CC Icons (path)
/themes/custom/learnful-theme/assets/cc-icons/cc.svg
/themes/custom/learnful-theme/assets/cc-icons/by.svg
Long Name
Creative Commons Attribution

Test 1

Content Blocks
Cover Image
Share in catalogue
Off
Top Bar Region - Tutorials
Creative Commons License

Login or register to join the discussion.

Comments

Be the first to comment!

Login or register to share your adaptations.

List of adaptions

Be the first to add your adaptation here!

Top Bar Region - Lesson - Clone
Display in Portfolio
Off
This work is a derivative
Off

Login or register to engage in the review and feedback process.

Reviews and Feedback

Be the first to review!

Unit 1

Creative Commons License
Cover Image
Share in catalogue
Off
Top Bar Region - Minibook
Display in Portfolio
Off
This work is a derivative
Off
Top Bar Region - Module - Clone

Login or register to join the discussion.

Comments

Be the first to comment!

Login or register to share your adaptations.

List of adaptions

Be the first to add your adaptation here!

Remix of Introduction to DSGN 8230

Content Blocks

Welcome to Week 1 of DSGN 820!

In this first week we have a number of topics to cover, including:

  • Introduction to the course
  • Introduction to your eTextbook
  • Getting started with Visual Studio
  • History of the Internet
  • Introduction to HTML5 and CSS

Required Preparations

Please ensure that you have prepared the following prior to our second class in week 1:

  • Make sure you can access your eText
  • Make sure you can access our course in BrightSpace
  • Make sure you have Visual Studio install on your laptop
  • Make sure you can access your School OneDrive
  • Read Chapter 1 in your eText
  • Complete the "Getting to know you" Survey
Illustration displaying numerous symbols and web design tools/languages.

So you want to be a Web Developer?

The History of the Internet

As you might expect for a technology so expansive and ever-changing, it is impossible to credit the invention of the internet to a single person. The internet was the work of dozens of pioneering scientists, programmers and engineers who each developed new features and technologies that eventually merged to become the “information superhighway” we know today.

Long before the technology existed to actually build the internet, many scientists had already anticipated the existence of worldwide networks of information. Nikola Tesla toyed with the idea of a “world wireless system” in the early 1900s, and visionary thinkers like Paul Otlet and Vannevar Bush conceived of mechanized, searchable storage systems of books and media in the 1930s and 1940s. 

Still, the first practical schematics for the internet would not arrive until the early 1960s, when MIT’s J.C.R. Licklider popularized the idea of an “Intergalactic Network” of computers. Shortly thereafter, computer scientists developed the concept of “packet switching,” a method for effectively transmitting electronic data that would later become one of the major building blocks of the internet.

The first workable prototype of the Internet came in the late 1960s with the creation of ARPANET, or the Advanced Research Projects Agency Network. Originally funded by the U.S. Department of Defense, ARPANET used packet switching to allow multiple computers to communicate on a single network. 

On October 29, 1969, ARPAnet delivered its first message: a “node-to-node” communication from one computer to another. (The first computer was located in a research lab at UCLA and the second was at Stanford; each one was the size of a small house.) The message—“LOGIN”—was short and simple, but it crashed the fledgling ARPA network anyway: The Stanford computer only received the note’s first two letters.

Symbolic representation of the Arpanet as of September 1974.

Symbolic representation of the Arpanet as of September 1974.

Encapsulation of application data descending through the layered IP architecture

Encapsulation of application data descending through the layers described in RFC 1122

The technology continued to grow in the 1970s after scientists Robert Kahn and Vinton Cerf developed Transmission Control Protocol and Internet Protocol, or TCP/IP, a communications model that set standards for how data could be transmitted between multiple networks. 

ARPANET adopted TCP/IP on January 1, 1983, and from there researchers began to assemble the “network of networks” that became the modern Internet. The online world then took on a more recognizable form in 1990, when computer scientist Tim Berners-Lee invented the World Wide Web. While it’s often confused with the internet itself, the web is actually just the most common means of accessing data online in the form of websites and hyperlinks. 

The web helped popularize the internet among the public, and served as a crucial step in developing the vast trove of information that most of us now access on a daily basis.

Cover Image
Share in catalogue
Off
Top Bar Region - Tutorials
Creative Commons License
Education Level
Educational Use
Material Type
Brief Description
This is a test of the Tutorial Resource builder.

Login or register to join the discussion.

Comments

Be the first to comment!

Login or register to share your adaptations.

List of adaptions

Be the first to add your adaptation here!

Top Bar Region - Lesson - Clone
Display in Portfolio
Off
This work is a derivative
Off

Login or register to engage in the review and feedback process.

Reviews and Feedback

Be the first to review!

1.2.2 Balance Sheet and Statement of Cash Flows

Content Blocks

The Balance Sheet

The balance sheet is also called the statement of financial position.

The balance sheet reports a company’s financial position as at a specific date (e.g., last day of a monthly, quarterly, or annual reporting period).  Since it is presented as at a specific date, you can think of the balance as a snapshot of the company’s financial position at a particular point in time.

Note: the other 3 statements cover a period of time.

From the balance sheet above, note the Accounting Equation (Assets = Liabilities + Shareholders’ Equity):
Total Assets = $90,973 which equals the Total Liabilities and Shareholders’ Equity = $90,973.

Balance Sheet Has Three Main Elements:

  1. Assets: Economic resources controlled by the entity as a result of past business events from which future economic benefits may be obtained.
    1. Current assets: Expected to be converted to cash, sold, or consumed during the next 12 months or within the business’ operating cycle, whichever is longer, and include:
      1. Cash and cash equivalents
      2. Short-term investments
      3. Accounts and notes receivable
      4. Inventory
      5. Prepaid expenses
    2. Non-current assets: Will be held longer than one year and include:
      1. Property and equipment
      2. Land
      3. Buildings
      4. Computers
      5. Equipment
      6. Intangibles
      7. Long-term investments
  2. Liabilities: Debts the entity owes as a result of a past event, and which it expects to pay off in the future using some of its assets.
    1. Current liabilities: Debts payable in the next 12 months or within the business’ operating cycle, whichever is longer, and include:
      1. Accounts payable
      2. Income taxes payable
      3. Accrued expenses payable
      4. Current maturities of long-term debt
    2. Non-current liabilities: Debts payable more than one year from the balance sheet date and include:
      1. Long-term notes payable
      2. Bonds payable
  3. Shareholders’ equity: Owners’ remaining interest in the assets of the company after deducting all its liabilities (i.e., owners’ claim on the company’s assets net of company’s liabilities, hence, called net assets), consisting of two components:
    1. Share capital: capital (usually in the form of cash) received from its owners in exchange for shares of the company. Also called common shares.
    2. Retained earnings: the cumulative net income earned by the company over its lifetime, less its cumulative net losses and dividends. 
      Note: a portion of net income is typically distributed to shareholders in the form of dividends and the remainder is retained by the business that is called retained earnings.
Alt text

Dividing net income into dividends (distributed to shareholders) and retained earnings (retained by the business).

The balance sheet takes its name from the fact that the assets (A) must always equal (be in balance with) the sum of the liabilities (L) and the shareholders' equity (SE).

A = L + SE

(Assets) = (Liabilities) + (Shareholders' Equity)

Assets refer to the economic resources of the company.

Companies can finance the economic resources in two ways:

  1. Liabilities: Financing provided by creditors
  2. Shareholders' equity: Financing provided by shareholders

Typical Account Titles

Assets Liabilities Shareholders’ Equity
Cash Trade Payables Share Capital
(or Common Shares)
Short-Term Investment Short-term Borrowing Retained Earnings
Trade Receivable Long-term Borrowing  
Notes Receivable Provisions  
Inventory (to be sold) Other Liabilities  
Cover Image
Share in catalogue
Off
Top Bar Region - Tutorials
Creative Commons License
Educational Use

Login or register to join the discussion.

Comments

Be the first to comment!

Login or register to share your adaptations.

List of adaptions

Be the first to add your adaptation here!

Top Bar Region - Lesson - Clone
Display in Portfolio
Off
This work is a derivative
Off

Login or register to engage in the review and feedback process.

Reviews and Feedback

Be the first to review!

Remix of Functions and Function Notation

Content Blocks

Learning Objectives

In this section, you will:

  • Determine whether a relation represents a function.
  • Find the value of a function.
  • Determine whether a function is one-to-one.
  • Use the vertical line test to identify functions.
  • Graph the functions listed in the library of functions.

A jetliner changes altitude as its distance from the starting point of a flight increases. The weight of a growing child increases with time. In each case, one quantity depends on another. There is a relationship between the two quantities that we can describe, analyze, and use to make predictions. In this section, we will analyze such relationships.

Determining Whether a Relation Represents a Function

A relation is a set of ordered pairs. The set consisting of the first components of each ordered pair is called the domain and the set consisting of the second components of each ordered pair is called the range. Consider the following set of ordered pairs. The first numbers in each pair are the first five natural numbers. The second number in each pair is twice that of the first.

$$\{(1,\text{ }2),\text{ }(2,\text{ }4),\text{ }(3,\text{ }6),\text{ }(4,\text{ }8),\text{ }(5,\text{ }10)\}$$

The domain is \(\{1,\text{ }2,\text{ }3,\text{ }4,\text{ }5\}\). The range is \(\{2,\text{ }4,\text{ }6,\text{ }8,\text{ }10\}\).

Note that each value in the domain is also known as an input value, or independent variable, and is often labeled with the lowercase letter \(x\). Each value in the range is also known as an output value, or dependent variable, and is often labeled lowercase letter \(y\).

A function \(f\) is a relation that assigns a single value in the range to each value in the domain. In other words, no x-values are repeated. For our example that relates the first five natural numbers to numbers double their values, this relation is a function because each element in the domain, \(\{1, 2, 3, 4, 5\}\), is paired with exactly one element in the range, \(\{2, 4, 6, 8, 10\}\).

Now let’s consider the set of ordered pairs that relates the terms “even” and “odd” to the first five natural numbers. It would appear as

$$\{{(\text{odd},\text{ }1),\text{ }(\text{even},\text{ }2),\text{ }(\text{odd},\text{ }3),\text{ }(\text{even},\text{ }4),\text{ }(\text{odd},\text{ }5)}\}$$

Notice that each element in the domain, \(\{even, odd\}\) is not paired with exactly one element in the range, \(\{1, 2, 3, 4, 5\}\). For example, the term “odd” corresponds to three values from the range, \(\{1, 3, 5\}\) and the term “even” corresponds to two values from the range, \(\{2, 4\}\). This violates the definition of a function, so this relation is not a function.

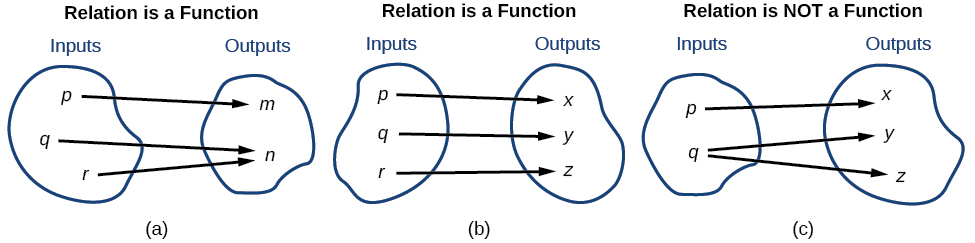
Figure 1 compares relations that are functions and not functions.

Three relations that demonstrate what constitute a function.

Figure 1 (a) This relationship is a function because each input is associated with a single output. Note that input  q  and  r  both give output  n.  (b) This relationship is also a function. In this case, each input is associated with a single output.

Functions

function is a relation in which each possible input value leads to exactly one output value. We say “the output is a function of the input.”

The input values make up the domain, and the output values make up the range.

Examples

Given a relationship between two quantities, determine whether the relationship is a function.

Using Function Notation

Once we determine that a relationship is a function, we need to display and define the functional relationships so that we can understand and use them, and sometimes also so that we can program them into computers. There are various ways of representing functions. A standard function notation is one representation that facilitates working with functions.

To represent “height is a function of age,” we start by identifying the descriptive variables \(h\) for height and \(a\) for age. The letters \(f\), \(g\), and \(h\) are often used to represent functions just as we use \(x, y\), and \(z\) to represent numbers and \(A, B\), and \(C\) to represent sets.

$$ \begin{array}{lcccc}h\text{ is }f\text{ of }a&&&&\text{We name the function }f;\text{ height is a function of age}.\\h=f(a)&&&&\text{We use parentheses to indicate the function input}\text{. }\\f(a)&&&&\text{We name the function }f;\text{ the expression is read as “}f\text{ of }a\text{.”}\end{array} $$

Remember, we can use any letter to name the function; the notation \(h(a)\) shows us that \(h\) depends on \(a\). The value a  a must be put into the function \(h\) to get a result. The parentheses indicate that age is input into the function; they do not indicate multiplication.

We can also give an algebraic expression as the input to a function. For example \(f(a+b)\) means "first add a and b, and the result is the input for the function f." The operations must be performed in this order to obtain the correct result.

Function Notation

The notation \(y=f(x)\) defines a function named \(f\). This is read as "\(y is a function of x\)". The letter \(x\) represents the input value, or independent variable. The letter \(y\), or \(f(x)\), represents the output value, or dependent variable.

Practice Quiz

Content for this page has been sourced from OpenStax - Access for free at https://openstax.org/books/algebra-and-trigonometry/pages/1-introduction-to-prerequisites

Cover Image
Share in catalogue
Off
Top Bar Region - Tutorials
Creative Commons License
Education Level
Educational Use
Material Type
Subject Area
Brief Description
A demonstration of the MathJax authoring capabilities. Content for this page has been sourced from OpenStax - Access for free at https://openstax.org/books/algebra-and-trigonometry/pages/1-introduction-to-prerequisites

Login or register to join the discussion.

Comments

Be the first to comment!

Login or register to share your adaptations.

List of adaptions

Be the first to add your adaptation here!

Top Bar Region - Lesson - Clone
Display in Portfolio
Off
This work is a derivative
Off

Login or register to engage in the review and feedback process.

Reviews and Feedback

Be the first to review!

phet simulation embed

Content Blocks
Cover Image
Share in catalogue
Off
Top Bar Region - Tutorials
Creative Commons License

Login or register to join the discussion.

Comments

Be the first to comment!

Login or register to share your adaptations.

List of adaptions

Be the first to add your adaptation here!

Top Bar Region - Lesson - Clone
Display in Portfolio
Off
This work is a derivative
Off

Login or register to engage in the review and feedback process.

Reviews and Feedback

Be the first to review!

1.2.2 Balance Sheet and Statement of Cash Flows

Content Blocks

The Balance Sheet

The balance sheet is also called the statement of financial position.

The balance sheet reports a company’s financial position as at a specific date (e.g., last day of a monthly, quarterly, or annual reporting period).  Since it is presented as at a specific date, you can think of the balance as a snapshot of the company’s financial position at a particular point in time.

Note: the other 3 statements cover a period of time.

From the balance sheet above, note the Accounting Equation (Assets = Liabilities + Shareholders’ Equity):
Total Assets = $90,973 which equals the Total Liabilities and Shareholders’ Equity = $90,973.

Balance Sheet Has Three Main Elements:

  1. Assets: Economic resources controlled by the entity as a result of past business events from which future economic benefits may be obtained.
    1. Current assets: Expected to be converted to cash, sold, or consumed during the next 12 months or within the business’ operating cycle, whichever is longer, and include:
      1. Cash and cash equivalents
      2. Short-term investments
      3. Accounts and notes receivable
      4. Inventory
      5. Prepaid expenses
    2. Non-current assets: Will be held longer than one year and include:
      1. Property and equipment
      2. Land
      3. Buildings
      4. Computers
      5. Equipment
      6. Intangibles
      7. Long-term investments
  2. Liabilities: Debts the entity owes as a result of a past event, and which it expects to pay off in the future using some of its assets.
    1. Current liabilities: Debts payable in the next 12 months or within the business’ operating cycle, whichever is longer, and include:
      1. Accounts payable
      2. Income taxes payable
      3. Accrued expenses payable
      4. Current maturities of long-term debt
    2. Non-current liabilities: Debts payable more than one year from the balance sheet date and include:
      1. Long-term notes payable
      2. Bonds payable
  3. Shareholders’ equity: Owners’ remaining interest in the assets of the company after deducting all its liabilities (i.e., owners’ claim on the company’s assets net of company’s liabilities, hence, called net assets), consisting of two components:
    1. Share capital: capital (usually in the form of cash) received from its owners in exchange for shares of the company. Also called common shares.
    2. Retained earnings: the cumulative net income earned by the company over its lifetime, less its cumulative net losses and dividends. 
      Note: a portion of net income is typically distributed to shareholders in the form of dividends and the remainder is retained by the business that is called retained earnings.
Image 1

Dividing net income into dividends (distributed to shareholders) and retained earnings (retained by the business).

The balance sheet takes its name from the fact that the assets (A) must always equal (be in balance with) the sum of the liabilities (L) and the shareholders' equity (SE).

A = L + SE

(Assets) = (Liabilities) + (Shareholders' Equity)

Assets refer to the economic resources of the company.

Companies can finance the economic resources in two ways:

  1. Liabilities: Financing provided by creditors
  2. Shareholders' equity: Financing provided by shareholders

Typical Account Titles

Assets Liabilities Shareholders’ Equity
Cash Trade Payables Share Capital
(or Common Shares)
Short-Term Investment Short-term Borrowing Retained Earnings
Trade Receivable Long-term Borrowing  
Notes Receivable Provisions  
Inventory (to be sold) Other Liabilities  
Cover Image
Share in catalogue
Off
Tags
Top Bar Region - Tutorials
Creative Commons License

Login or register to join the discussion.

Comments

Be the first to comment!

Login or register to share your adaptations.

List of adaptions

Be the first to add your adaptation here!

Top Bar Region - Lesson - Clone
Display in Portfolio
Off
This work is a derivative
Off

Login or register to engage in the review and feedback process.

Reviews and Feedback

Be the first to review!

1.2.1 Income Statement and Statement of Retained Earnings

Content Blocks

Income Statement

The income statement is also called the statement of profit and loss.

  • It measures a company’s operating performance for a specific period of time such as a month, a quarter, or a year.

  • On the income statement, we subtract expenses from revenues to arrive at net earnings (net income or profit).

  • Common year-ends by industries:

    • Most companies: Dec 31
    • Canada’s big banks: Oct 31
    • Many retailers: Jan 31

Revenues and Expenses

Let’s first examine the income statement heading, and then the income statement elements. Below is an Excel spreadsheet that requires you to sign in to Office 365. Office 365 will be used throughout this course to display tables and complete concept checks. 

If you cannot see the Excel spreadsheet below, please follow the instructions for Viewing embedded content in Chrome.

Income statements provide financial information for a period in time. For example, as shown above, it is “for the year ended December 31, 20XX.” In comparison, the balance sheet reflects the information for a point in time, “As at December 31, 20XX.”

The income statement has two main elements:

  1. Total revenue consists of:

    1. Revenue: earned by a company in the course of its ordinary, day-to-day business activities such as the sale of a company’s primary goods and services.
    2. Gains: earned from peripheral business activities.
  2. Total expenses consists of:

    1. Expenses: incurred in the course of ordinary business activities.
    2. Losses: incurred in the course of peripheral activities.

Revenues minus expenses are reported as net income

  • If revenues > expenses  → net income, also known as net profit.

  • If revenues < expenses →  net loss.

Case Examples of Total Revenue and Total Expenses

Apple Inc.’s ordinary revenues come from retail sales of products and services; peripheral revenues may include sales from land owned by Apple Inc.

Apple Inc.’s ordinary expenses include the cost of manufacturing the iPhone, laptops, iWatch, and other Apple products.

Typical Account Titles

Revenues Expenses
Sales Revenue Cost of Sales
Fee Revenue Wages Expense
Interest Revenue Rent Expense
Rent Revenue Interest Expense
  Depreciation Expense
  Advertising Expense
  Insurance Expense
  Repair Expense
  Income Tax Expense

Statement of Retained Earnings

What Are Retained Earnings?

  • Put simply, retained earnings are the accumulated net income/losses since the company’s inception, less any dividends declared to shareholders. The statement of retained earnings reports the changes in retained earnings during the same period covered by the income statement. 

Positive Balance v. Negative Balance

  • When historical income is greater than expenses and dividends, the result will be a positive balance in retained earnings.

  • When historical expenses and dividends are greater than income, the result will be a negative balance in retained earnings called deficit.

Review the statement of retained earning and note the following elements:

  1. Opens with beginning retained earnings balance (Dec 31, 2018 above)

  2. Adds net income (or subtracts net loss)

    1. Flows from the income statement
  3. Subtracts dividends
  4. Reports ending retained earnings balance (Dec 31, 2019 above)

Cover Image
Share in catalogue
Off
Tags
Top Bar Region - Tutorials
Creative Commons License

Login or register to join the discussion.

Comments

Be the first to comment!

Login or register to share your adaptations.

List of adaptions

Be the first to add your adaptation here!

Top Bar Region - Lesson - Clone
Display in Portfolio
Off
This work is a derivative
Off

Login or register to engage in the review and feedback process.

Reviews and Feedback

Be the first to review!

AFM 101 Unit 1

Creative Commons License
Cover Image
Share in catalogue
Off
Top Bar Region - Minibook
Introduction

IMPORTANT
This list of content pages may not include all information and resources in the entire course. Please visit LEARN for the Course Outline, Activities and Assessments details, as well as other course content, pages, and resources not included here.

Tags
Display in Portfolio
Off
This work is a derivative
Off
Top Bar Region - Module - Clone

Login or register to join the discussion.

Comments

Be the first to comment!

Login or register to share your adaptations.

List of adaptions

Be the first to add your adaptation here!

1.2 Exploring Financial Statements

Content Blocks

The Generally Accepted Accounting Principles (GAAP)

The four main financial statements were briefly introduced in the first topic. The basis on which these financial statements are prepared is known as the Generally Accepted Accounting Principles (GAAP). These standards, which specify that financial information must be recorded, measured, and reported, are universally used by accountants to prepare financial statements consistently.

There are multiple sets of GAAP and each is applicable based on the type of entity or organization.

In Canada, GAAP are established by the Chartered Professional Accountants (CPA) of Canada.

  • Canadian public enterprises (stock-listed corporations) must use International Financial Reporting Standards (IFRS).
  • IFRS are set by the International Accounting Standards Board (IASB).
  • For example: Canadian Tire is listed on the TSX (CTC.A) and must use IFRS to report its financial statements.

However, Canadian private enterprises (not issued stock or debt on public markets) can use either IFRS or Accounting Standards for Private Enterprises (ASPE). Most private companies use ASPE to prepare their financial statements. This is because IFRS is costly and complex, especially for larger companies with complex operations.

Other sets of GAAP are applicable to not-for-profit organizations, pension plans, and government entities. You will learn about these GAAP in advanced accounting courses.

(Adapted from Harrison et al., 2018, p. 7–8) 

The Four Financial Statements

The financial statements prepared using these standards help stakeholders assess the performance of the business for a given period. This table provides a great overview of the purpose served and questions answered by each of these financial statements:

Question Financial Statement Elements
1. How well did the company perform during the year? Income statement Revenues + gains
– (Expenses + losses)
Net income or (net loss)
2. Why did the company's retained earnings change during the year? Statement of retained earnings Beginning retained earnings
+ Net Income
+ Other comprehensive income
– Dividends
Ending retained earnings
3. What is the company's financial position at year-end? Balance sheet Assets = Liabilities + Owners' equity
4. How much cash did the company generate and spend during the year? Statement of cash flows Operating cash flows
+/– Investing cash flows
+/– Financing cash flows
Increase (decrease) in cash

(Harrison et al., 2018, p. 7)


Let’s take a look at each of these financial statements in greater detail.

Cover Image
Share in catalogue
Off
Top Bar Region - Tutorials
Creative Commons License

Login or register to join the discussion.

Comments

Be the first to comment!

Login or register to share your adaptations.

List of adaptions

Be the first to add your adaptation here!

Top Bar Region - Lesson - Clone
Display in Portfolio
Off
This work is a derivative
Off

Login or register to engage in the review and feedback process.

Reviews and Feedback

Be the first to review!