Remix of Indigenous Vocabulary: Algonquin Words
- Read more about Remix of Indigenous Vocabulary: Algonquin Words
- Log in or register to post comments
- 56 views
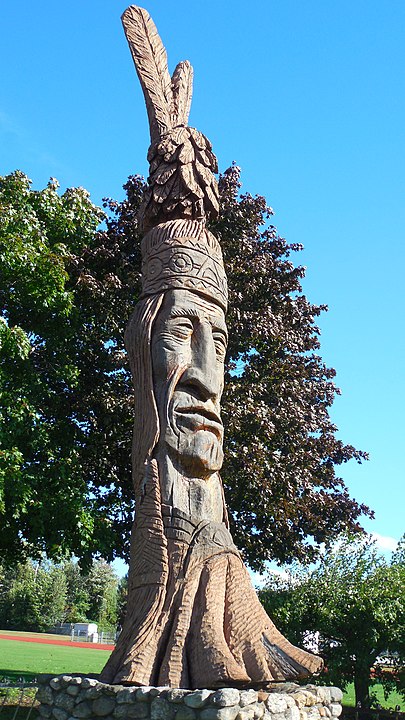
Statue of Keewakwa Abenaki Keenahbeh in Opechee Park in Laconia, New Hampshire (standing at 36 ft.). Sources: Sculptor: Peter Wolf Toth / Photo by: Niranjan Arminius - Own work, CC BY-SA 4.0, https://commons.wikimedia.org/w/index.php?curid=51375010
The Abenaki (Abnaki, Abinaki, Alnôbak) are a Native American tribe and First Nation. They are one of the Algonquian-speaking peoples of northeastern North America. The Abenaki originated in a region called Wabanahkik in the Eastern Algonquian languages (meaning "Dawn Land"), a territory now including parts of Quebec and the Maritimes of Canada and northern sections of the New England region of the United States. The Abenaki are one of the five members of the Wabanaki Confederacy.
The Abenaki language is closely related to the Panawahpskek (Penobscot) language. Other neighboring Wabanaki tribes, the Pestomuhkati (Passamaquoddy), Wolastoqiyik (Maliseet), and Miꞌkmaq, and other Eastern Algonquian languages share many linguistic similarities. It has come close to extinction as a spoken language. Tribal members are working to revive the Abenaki language at Odanak (means "in the village"), a First Nations Abenaki reserve near Pierreville, Quebec, and throughout New Hampshire, Vermont and New York state.
Twenty Basic Words in Algonquin
Abenaki is an Algonquian language, related to other languages like Lenape and Ojibwe. We have included twenty basic Algonquin words here.
Algonquin Word Set
| English (Français) | Algonquin Words |
| One (Un) | Pejig |
| Two (Deux) | Nìj |
| Three (Trois) | Niswi |
| Four (Quatre) | New |
| Five (Cinq) | Nànan |
| Man (Homme) | Ininì |
| Woman (Femme) | Ikwe |
| Dog (Chien) | Animosh |
| Sun (Soleil) | Kìzis |
| Moon (Lune) | Tibik-kìzis |
| Water (Eau) | Nibì |
| White (Blanc) | Wàbà |
| Yellow (Jaune) | Ozàwà |
| Red (Rouge) | Miskwà |
| Black (Noir) | Makadewà |
| Eat (Manger) | Mìdjin |
| See (Voir) | Wàbi |
| Hear (Entendre) | Nòndam |
| Sing (Chanter) | Nigamo |
| Leave (Partir) | Màdjà or Nagadàn |
Test your memory
Please note: the content on this page, sourced from http://www.native-languages.org/algonquin_words.htm, is meant for demonstration purposes only.

Login or register to share your adaptations.
List of adaptions
Be the first to add your adaptation here!
Login or register to engage in the review and feedback process.
Reviews and Feedback
Be the first to review!


Comments
Be the first to comment!